

![MT5 Usage Guide [A must-read for beginners] Thorough comparison of recommended FX brokerages!](https://i0.wp.com/smart-trading-strategy.com/wp-content/uploads/2023/12/2023-12-06-22.25.28.jpg?fit=1792%2C1024&ssl=1)


Contents
- 1 Dow Theory Indicator developed!
- 2 What is the Dow Theory?
- 3 Can Dow Theory be applied to FX trading?
- 4 Trading strategies based on Dow Theory
- 5 Easily utilize Dow Theory with MT5 Custom Indicators!
- 6 summary
Dow Theory Indicator developed!
We have developed an MT5 indicator that applies the Dow Theory approach. (I spent several months developing one indicator...)
We are pleased to introduce you to the actual use of the system, which has dramatically simplified market analysis and strategy formulation, which used to be time-consuming, and enabled us to make quick transaction decisions.

What is the Dow Theory?
Origin of the Dow Theory
Dow Theory is an analytical method created by Charles Dow in the late 19th century. He was the founder of stock indices and proposed Dow Theory as a new approach to understanding market movements. The theory revolutionized market analysis at the time and continues to be referenced in a wide range of financial markets to this day.
Key Principles of Dow Theory
Central to Dow Theory is the idea that market trends are shaped by certain principles. The key principles are as follows
1. the market will factor in everything
Market prices reflect all known information - economic, political, psychological, and all other factors. This represents the idea that prices are always determined based on the most current information in the market.
2. existence of three trends
According to Dow Theory, market trends are classified into three types (long-term, medium-term, and short-term). Long-term trends (primary trends) represent major market developments, medium-term trends (secondary trends) represent corrections or reactions to long-term trends, and short-term trends (minor trends) represent daily market fluctuations.
3. three stages of trends
Each trend has three phases. The accumulation phase is when well-informed investors enter the market, the participation phase is when the public enters the market and prices begin to move, and the distribution phase is when prices peak and early investors lock in profits.
4. cross-checking of averages
When analyzing market trends, different market indicators and averages need to confirm each other. The reliability of a trend is enhanced when several indicators, not just one, show similar movements.
Confirmation of trend by volume
The strength or reliability of a trend is also confirmed by volume. If prices rise when volume increases, the trend is considered strong and vice versa.
6. continuation until a clear conversion signal
The trend is expected to continue until a clear turning signal appears. This suggests the importance of following the existing trend until a change is identified regarding market movements.
Can Dow Theory be applied to FX trading?
How Dow Theory is Applied in the FX Market
In the FX market, the Dow Theory principle of "the market incorporates all information" applies directly because exchange rate movements are strongly influenced by international economic and political events. In addition, due to the nature of the forex market, it is particularly important to identify short- to long-term trends. For example, long-term trend analysis allows one to understand underlying economic direction and policy changes and to develop trading strategies based on this understanding.
The Dow Theory's concept of medium-term and short-term trends also correlates with volatility in the FX market. For example, the release of important economic indicators or political events can affect medium-term trends. Short-term trends are often influenced by daily news and market sentiment.
Trading strategies based on Dow Theory
Applying Dow Theory to Forex trading allows you to understand market movements and build powerful strategies for making lucrative trades. We will introduce you to specific approaches in trading strategies based on Dow Theory and a home-made indicator that anyone can easily replicate.
Identification of trend turning points
Identifying trend turning points is very important in a Dow Theory-based trading strategy. Turning points are locations where the direction of the trend may change, and by identifying them, you can change positions early to secure profits or minimize losses. To identify turning points, closely analyze market highs and lows and other technical indicators.
Trend Tracking Strategy
A trend-following strategy is a method of taking a position in line with the major trend indicated by the market. The key to this strategy is to identify a trend on a given basis and invest in its direction. For example, if the long-term trend is upward, the trader would consider taking a buy position. Conversely, if the trend is downward, a sell position is advantageous.
By identifying trend turning points based on the Dow Theory, it is possible to determine uptrend intervals and downtrend intervals on a certain basis. This narrows down the direction in which entry is considered advantageous, and by taking other conditions into account when making trades, the winning rate can be increased.
risk management
The fact that the trend turns at the push-low and return-high lines, which are the trend turning points of the Dow Theory,
- The uptrend has ended and it is desirable to close out (i.e., cut losses on) the buy positions held
- The downtrend has ended and it is desirable to close out (= cut losses on) sell positions held
We can think of it as.
Push lows and return highs will be rounded up/down in stages as the trend continues. This allows for smaller losses by adjusting the stop-loss line to more favorable conditions based on the evidence.
Easily utilize Dow Theory with MT5 Custom Indicators!
We have developed a custom indicator for market environment recognition and entry point identification based on several ideas of Dow Theory.
trend section determination
Trend turning points and the trend direction in the current bar can be seen at a glance.

Trend turning line (push low, return high)
The term "push low" refers to the most recent low rate during an uptrend segment.
At the timing when the break of the highest recent price is confirmed, the previous low is used as the push low.
In a market that is gradually making higher highs, the push-lows will also cut higher.
When the push low is below the bar, the uptrend is considered to be over and the downtrend has entered.

The "return high" refers to the most recent high rate during a downtrend section.
At the timing when the most recent low break is confirmed, the previous high is used as the return high.
In a market that cuts the lows in stages, the return highs also cut back.
When the high is exceeded by the bar entity, the downtrend is considered to be over and the uptrend has entered.

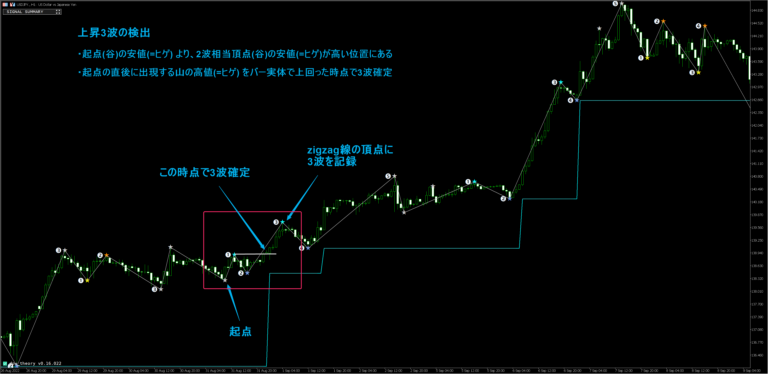
Wave detection and automatic counting
To identify specific entry points within trend following, it is useful to evaluate the waveform and continuity of the trend.
The word "wave" generally reminds us of Elliott Waves, but in this case
- Highs in an uptrend
- Lower lows in a downtrend
is considered to indicate the continuation of a trend, we have incorporated our own judgment process to identify the wave.
In addition to simply detecting waves, we also performed an automatic count of waves to assess their continuity and entry dominance.
This will make it easier to determine whether the idea of "3 or 5 waves are likely to grow, but if it continues to 7 or 9 waves, it is likely to stall" is valid or not.
buy-sell signal
Displays a buy or sell signal when a trend change or a specific wave count is detected.
Relationship between trend direction and trading signals
- A buy signal occurs only during an uptrend.
- A sell signal is generated only during a downtrend.

Profit and Loss Simulation
When a signal is generated, a fictitious stop-loss rate and profit rate are assigned to the signal, and the profit/loss calculation is performed using whichever rate is reached first, with a positive profit indicating a win and a negative profit indicating a loss.
The stop-loss rate fluctuates over time, so even if you reach the stop-loss rate, you win if your profit is positive.
Derivation of stop-loss rate
- In the case of an uptrend (=buy signal), the push-low rate is used as a stop loss.
- The push-low price fluctuates due to the occurrence of a high-high cut-off, and the value after the fluctuation at the relevant time is used as the stop-loss rate as appropriate.
- In the case of a downtrend (=sell signal), the return high rate is used as the stop loss rate.
- The return high price will fluctuate due to the occurrence of a cut-off of the low price, and the value after the fluctuation at the relevant time will be used as the stop-loss rate as appropriate.
Derivation of interest rates
- The profit rate is automatically calculated according to the risk reward rate specified from the parameters.
- If the price range determined by the push low, return high and signal price is set to 1, the profit rate is the price range based on the risk-reward rate.
<Example>
Signal Direction: Buy
Signal rate: 150.000
Stop loss rate : 149.500
If the stop-loss range = 150.000 - 149.500 = 0.500
If the risk-reward ratio is 0.8,
150.000 + <Stop-loss price range: 0.500 > x 0.8 = 150.400 is the profit rate.
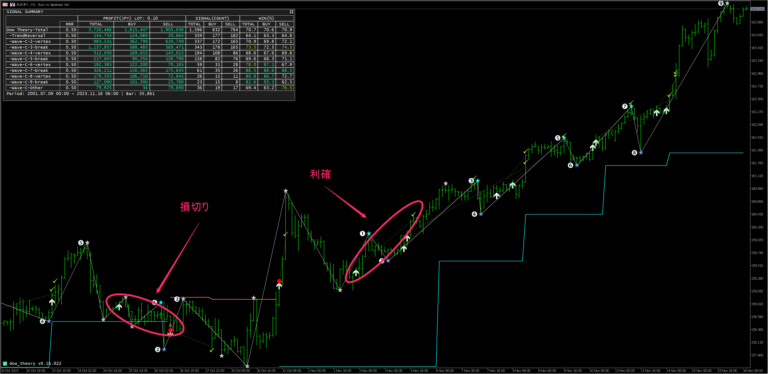
Simulation results of profit and loss by signal
Automatically calculates a hypothetical profit when trading a specified number of lots based on buy/sell signals and profit/loss conditions.
For example, it is possible to determine in an instant whether or not it is advantageous to enter the USDJPY at the time of the third wave detection on the 1-hour time frame.

summary
Custom indicators make Dow Theory utilization much easier.
- Visually determining the location of push lows and return highs is very painstaking. Even if you manually draw lines based on the confirmed results, maintenance is very time-consuming because the relevant rates fluctuate with each passing hour. With a custom indicator, all of this can be automated.
- The system will be able to automatically detect and notify you of trend changes and buy/sell signals. Even when you are not looking at the charts, you will be immediately aware of signals and can decide whether to trade or not.
- Profit and loss simulation is completed in an instant. Verification of historical data can be completed automatically to determine which stocks and timeframes are effective for trend-following strategies and whether specific entry points are advantageous or disadvantageous.
- These things can be achieved by anyone, regardless of the amount of personal knowledge or experience.
Custom indicators have so many advantages that we encourage you to consider utilizing them.
Use multiple indicators in combination!
To improve the accuracy of technical analysis, it is essential to evaluate multiple indicators in combination with each other in a comprehensive manner.
We are expanding our lineup of originally developed indicators on this site so that they can be used immediately,
Please also refer to the other indicator introduction articles.


Indicators are available free of charge!
This indicator is
Aiming for 100% annual interest! Automated Trading Tool Helios
is distributed free of charge to those who use the automated trading tool "Helios" in their real accounts.

We will provide you with an indicator and a set of support documents when you contact us through our service desk.
*Indicator-only use is available for a fee. Please contact the service desk for details.
If you want to use MT5, I recommend an overseas brokerage firm!
The secret to successful FX investing with MT5 is to combine it with an international brokerage firm.
Domestic Securities Companies
❌ Few MT5-compliant vendors exist.
❌ There is a risk of additional margin. May incur losses in excess of the amount deposited.
Securities Companies
✅ Many brokerages offer a zero-cut system that allows you to risk no more than the amount of your deposit.
✅ Major foreign brokerages such as HFM and XM are safe to use.
- Ability to trade in a low spread environment
- Take advantage of deposit bonuses to start trading with small amounts
- No deposit and withdrawal problems.
- Stable execution with minimal trade delays
If you use MT5, please consider opening an account at an overseas brokerage firm.
Don't miss new articles!
Free indicators will be developed and added as needed. To ensure that you do not miss any new articles, please also use the notification settings.

summary
To achieve efficient investment,
structuring and automation
is essential.
We will continue to compile ideas to help you analyze the market environment and provide you with tools that you can use immediately.
Automated trading tools make it possible to automate trades, but the decision of when to start and stop the EA is a personal decision.
In order to use the EA wisely, we hope you will make use of the indicator to help you analyze the market environment.
![MT5 Usage Guide [A must-read for beginners] Thorough comparison of recommended FX brokerages!](https://i0.wp.com/smart-trading-strategy.com/wp-content/uploads/2023/12/2023-12-06-22.25.28.jpg?fit=300%2C171&ssl=1)


